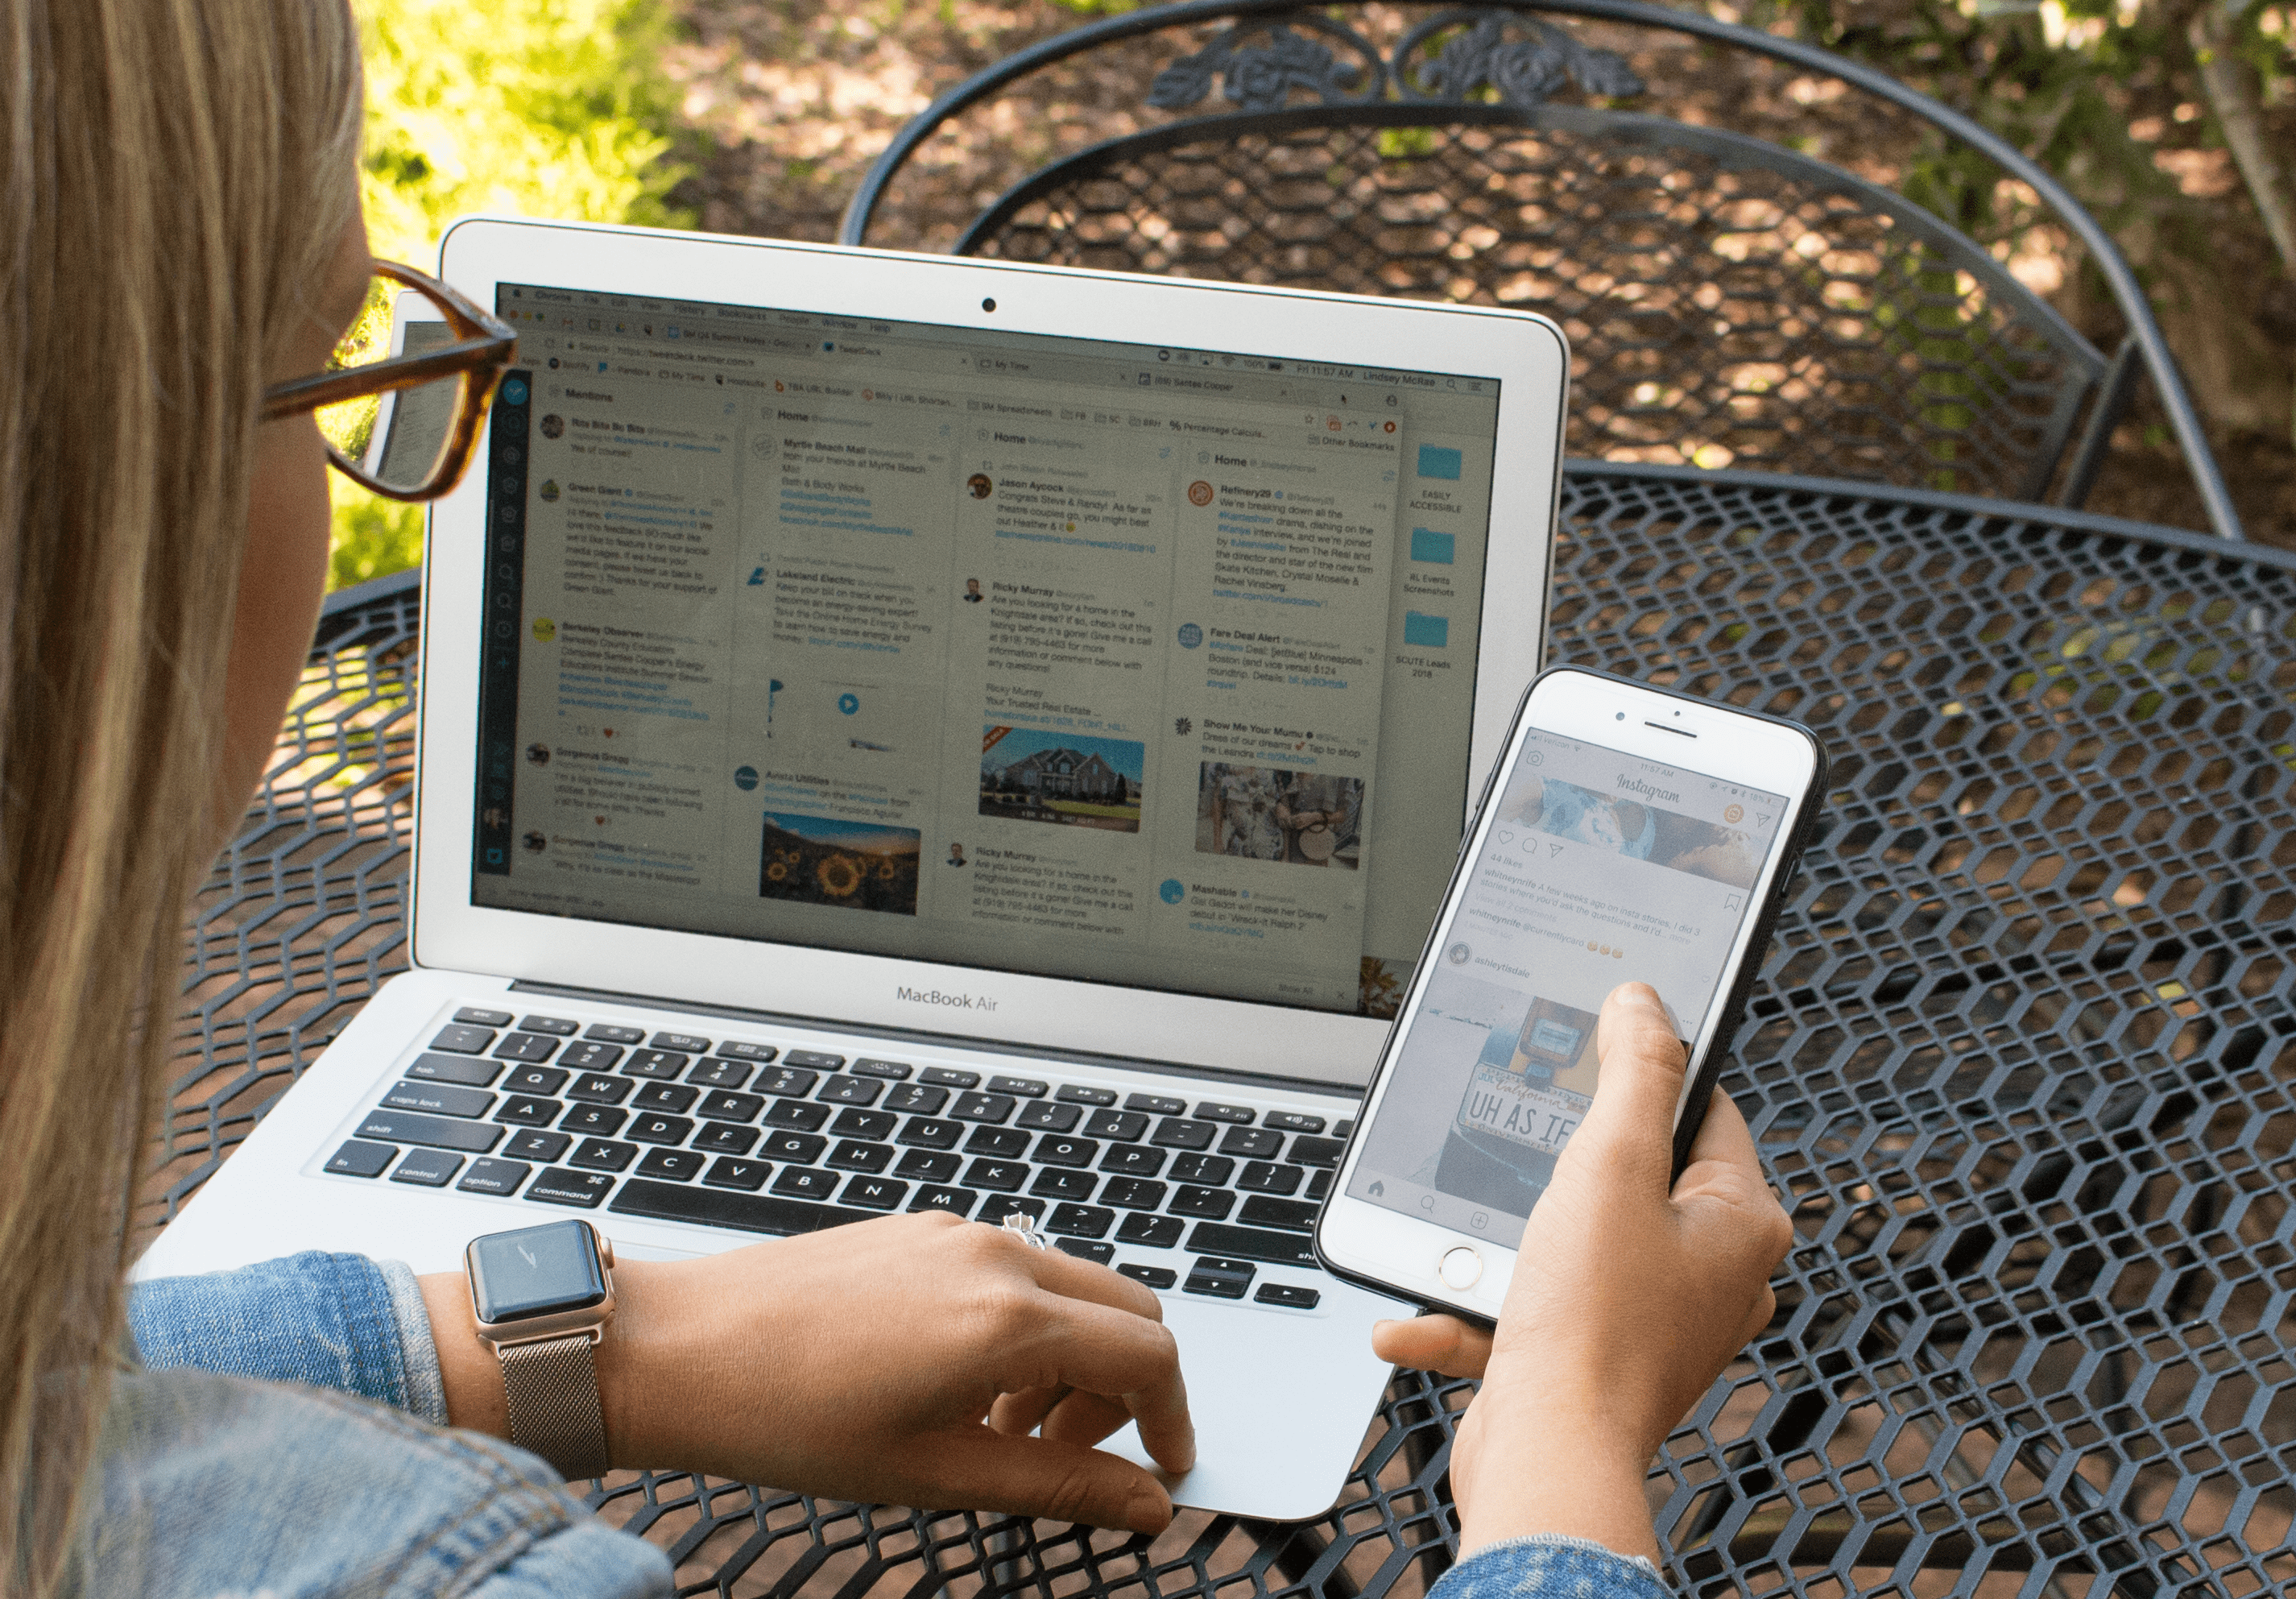
Based on a new report from The Nielsen Company, the casual observer might envision that two U.S. industries are especially poised to benefit from the media-consumption habits of the 21st century American — the fitness industry and the marketing industry. As for the former, we’ll leave that topic to another company and another blog. But when it comes to marketing, we see loads of opportunity (and some significant insights) in the report’s findings.
First, the report’s most moving takeaway: American adults now spend 11-plus hours of their average day watching, reading or otherwise interacting with media. That’s an awful lot of screen time (cue the Gold’s Gym and Weight Watchers pitches), as well as a mighty big window for marketers looking to connect with consumers.
Here’s the rundown on how the media time is spent, on average:
- nearly 4.2 hours watching live TV
- nearly 2.4 hours using the web or an app on a smartphone
- just short of 1.8 hours listening to the radio
- 47 minutes using the web or an app on a tablet
- 39 minutes viewing the internet on a computer
- 36 minutes watching time-shifted TV
- another 46 minutes using a DVD/Blu-ray device, game console or other internet-connected device
At 11 hours and 6 minutes, the Q1 2018 totals are up from 10 hours, 47 minutes in Q4 2017, and 10 hours, 30 minutes in Q3 2017. And while the time spent connected keeps growing, so does the number of media platforms — lending additional challenges and complexity to deciding which ones to put in the marketing mix. Still, marketers have never had more ways (or more time) to reach their target audiences, and the trends don’t appear to be slowing.
Among the report’s other marketing insights:
- The popularity of traditional media platforms, including live TV, time-shifted TV and radio, appear to be holding steady despite the onslaught of new media platforms. 92% of American adults still consume radio on a weekly basis, while 88% still view live and time-shifted TV weekly.
- Consumption of digital content (on computers, smartphones and tablets) is seeing steady growth, with users adding 13 minutes of this type of screen time in Q1 2018 over Q4 2017. Unsurprisingly, nearly 70% of the time spent on these digital platforms can be attributed to the never-leave-home-without-it-these-days smartphone.
- While older generations tend to spend more time consuming television, and younger Americans tend to be the first to adopt newer technologies, radio consumption appears to hold steady across all age demographics, consistently accounting for 14% to 17% of American adults’ daily media consumption across all represented age demographics.
- Leading all age groups in use of digital platforms, U.S. adults age 18-34 devote 43% of their media time to computers, smartphones and tablets, with nearly a third of their total media time (29%) captured by the smartphone. Their use of TV-connected devices (think Roku, Google Chromecast, Amazon Fire TV, smart TV apps, etc.) is seven times that of adults 65 and up.
- Across TV and all digital platforms, video content rules the day — it accounts for nearly 6 hours of the average American adult’s daily media intake.
- Social networking is claiming a substantial chunk of U.S. adults’ media time, with the 18-and-up population spending an average of 45 minutes per day on their social networks in Q1 2018. A whopping 34 of those minutes are devoted to social networking on a smartphone.
To take a deeper dive into the report’s findings, visit the Nielsen website. And when you’re ready to get your brand’s message in front of today’s media-savvy consumer, contact the experts at The Brandon Agency. With a daily focus on ROI, KPIs and turning data into weapons, our team of results-obsessed idea generators is ready to deliver better outcomes at a better value — and to help your business grow.

