Statistics show that people love statistics. A recent infographic from DOMO revealed some very interesting stats on how much data we generated every minute on the web, and some of the numbers are mind-boggling. Here’s a glimpse:
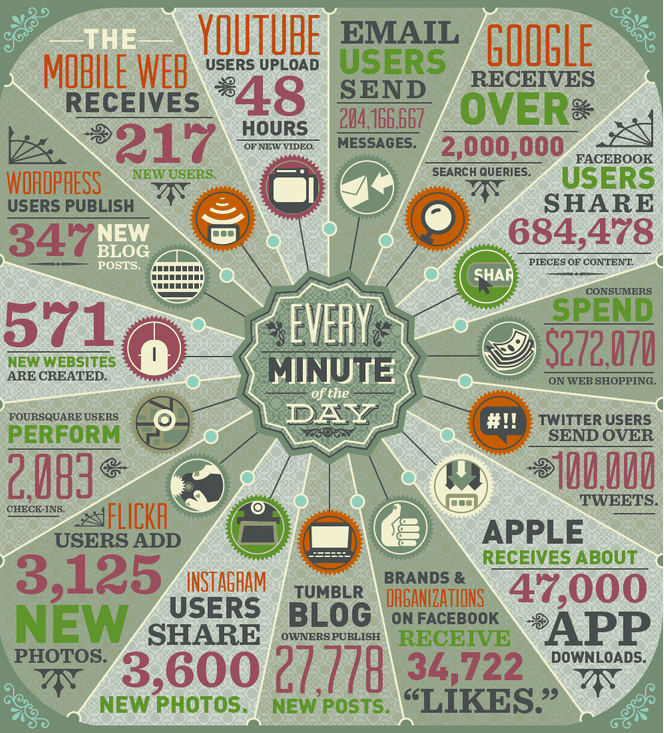
Every 60 seconds,
· Brands and organizations on Facebook receive 34,722 “Likes”.
· Facebook users share 684,478 pieces of content.
· Twitter users send over 100,000 Tweets.
· YouTube users upload 48 hours of new video.
· 571 new websites are created.
· Google receives over 2,000,000 search queries.
· The mobile web receives 217 new users.
· Email users send 204,166,667 messages.
As Internet marketers, we look at these statistics to get a general idea of how people are using the Internet, including social media sites, to connect with the world around them, from close friends to complete strangers, businesses, brands and celebrities.
We generate massive amounts of data every minute of every day, so how does one person, company or brand stand out in the crowd?
The key lies in answering the following questions:
1.) Is your content likeable?
2.) Is your content interesting enough to share? Does it incite people to start talking about your brand?
3.) Are people tweeting about you? Are your tweets eliciting responses?
4.) Does your YouTube video have what it takes to stand out? Are you creating viral content?
5.) Are you effectively incorporating SEO tactics into your online strategy?
6.) Is your website search engine friendly? Does your brand rank high in popular search engines such as Google, or is it buried deep down in the search results?
7.) Is your website optimized for mobile devices?
8.) Are your emails getting lost in the inbox clutter?
If you answered yes to the questions above, you’re on the right track. If you can’t, it’s probable that your efforts to connect with your target audience via the Internet are getting lost in the data.
To view the entire infographic, click here.
By subscribing to our newsletter, you agree to our Privacy Policy.